Dimensional modelling explained
Dimensional modelling is a foundational concept in data automation and warehousing that identifies the relationships between different types of data. This guide will help you understand dimensional modelling and walk you through the key elements, schemas, and steps involved in designing an effective dimensional model.
Introduction
One of the most common approaches to dimensional modelling is the Kimball methodology, introduced in the 1990s. This methodology focuses on creating user-friendly dimensional models, often using star schemas, and delivering value through iterative development. It emphasises on designing data warehouses by identifying key business processes, defining facts and dimensions, and aligning the data model with the organisation’s analytical goals.
Why is dimensional modelling important?
Dimensional modelling simplifies complex data structures. It acts as a blueprint for building a scalable, maintainable and high-performing data system and ensures a database, warehouse or automation plaform can handle growing volumes of data while remaining easy to manage. Dimensional modelling is one of the first steps in creating an effective data automation strategy.
In recent years, some organisations have moved away from traditional data modelling methods like star schemas, choosing instead to create isolated “data products” with intermediary tables and logic to generate an Output Business Table (OBT). While this can seem flexible at first, it often becomes tricky to manage as more data products are added, leading to unnecessary complexity and higher costs. Dimensional modelling offers a simpler, more organised approach that keeps data systems efficient, scalable, and easier to maintain in the long run.
Key elements of dimensional modelling
Dimensional modelling consists out of a few core elements. Below, we’ll go through each of these elements and exlplain their meaning.
Fact table
A fact table stores quantitative data that can be quantified and aggregated. Facts are usually numeric and are associated with dimensions, which provide context to the data. Fact tables have foreign keys that link to dimension tables. A fact table can be queried alongside dimension tables to provide meaningful insights.
Consider Uber as an example: a ride represents a key business event. Once a ride is completed, it becomes a fixed fact in the system. For instance, you can analyse total revenue from rides, calculate the average ride distance, or track the total tips earned by a specific driver.
Dimension table
Dimensions, on the other hand, provide descriptive context to the facts and are usually grouped by domains of similar information. They describe the “who,” “what,” “when,” “where,” and “why” of the facts. They allow you to slice and dice the data for deeper insights. For example, you can analyse ride durations by region, compare driver ratings, or evaluate the performance of different car models.
By structuring the data into fact and dimension tables, you can create a dimensional model that supports efficient querying and reporting.
Primary key
In dimensional modelling, a primary key uniquely identifies each dimension record, such as a customer, product, or date. In fact tables, the primary key is often a composite key made up of foreign keys referencing the related dimension tables. This structure enables you to create meaningful relationships betweeen tables and more comples queries for further analysis.
Foreign key
A foreign key is used to join data from two different tables (usually connecting a fact table to a dimension table). It connects rows by ensuring that a value in one table matches the value in another.
In dimensional modelling, foreign keys are essential for creating the relationships between fact and dimension tables, enabling users to query related data across multiple tables. They ensure that relationships between tables remain consistent by enforcing rules that prevent invalid data from being inserted. For example, a foreign key in a fact table referencing a dimension table ensures that every fact is associated with a valid dimension record.
Primary and foreign keys: an example
Let’s explore another example using Uber to better understand how primary and foreign keys work together to uniquely identify rows and establish relationships between tables.
| Ride ID | Driver Name | Driver ID | Vehicle Type |
|---|---|---|---|
| 001 | John Doe | 12345 | Sedan |
| 002 | Jane Smith | 67890 | SUV |
| Driver Information table |
In the Driver Information table, each driver is uniquely identified by their Driver ID, which acts as the primary key. This table doesn’t include any foreign keys since it doesn’t reference any other tables.
| Ride ID | Ride Date | Fare Amount | Driver ID |
|---|---|---|---|
| 001 | 2025-02-01 | 25.50 | 12345 |
| 002 | 2025-02-02 | 30.00 | 67890 |
| Ride Information table |
In the Ride Information table, each ride has a unique Ride ID, which is the primary key for this table. The Driver ID in the Ride Information table acts as a foreign key because it links each ride to a specific driver in the Driver Information table. This relationship is a one-to-many relationship: one driver can have many rides, but each ride is associated with only one driver.
Primary keys enforce constraints that prevent duplicate or null values in the key column(s), ensuring the data model is reliable.
Different types of schemas
The most common schemas in dimensional modelling are star and snowflake schemas.
- Star schema: a star schema consists of a central fact table that is connected to one or more dimension tables. The fact table contains the quantitative data for analysis, while the dimension tables contain descriptive attributes related to the facts.
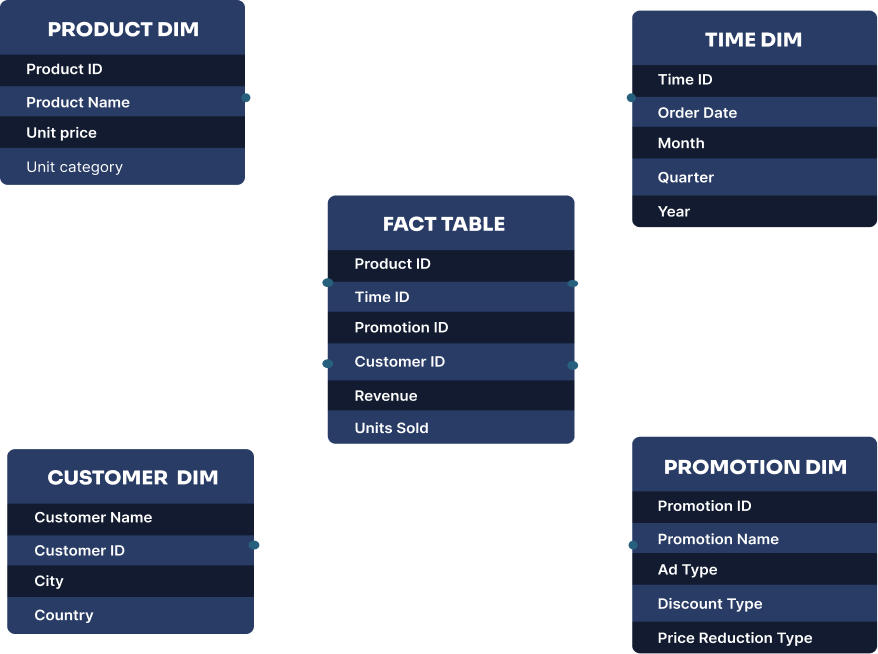
The star schema is called a “star” because the diagram of the schema resembles a star, with the fact table at the center and the dimension tables radiating out from it.
- Snowflake schema: a snowflake schema is a more complex version of the star schema. It consists of a central fact table that is connected to multiple dimension tables, which are further normalised into additional tables. This results in a more complex structure that can be harder to understand and query.
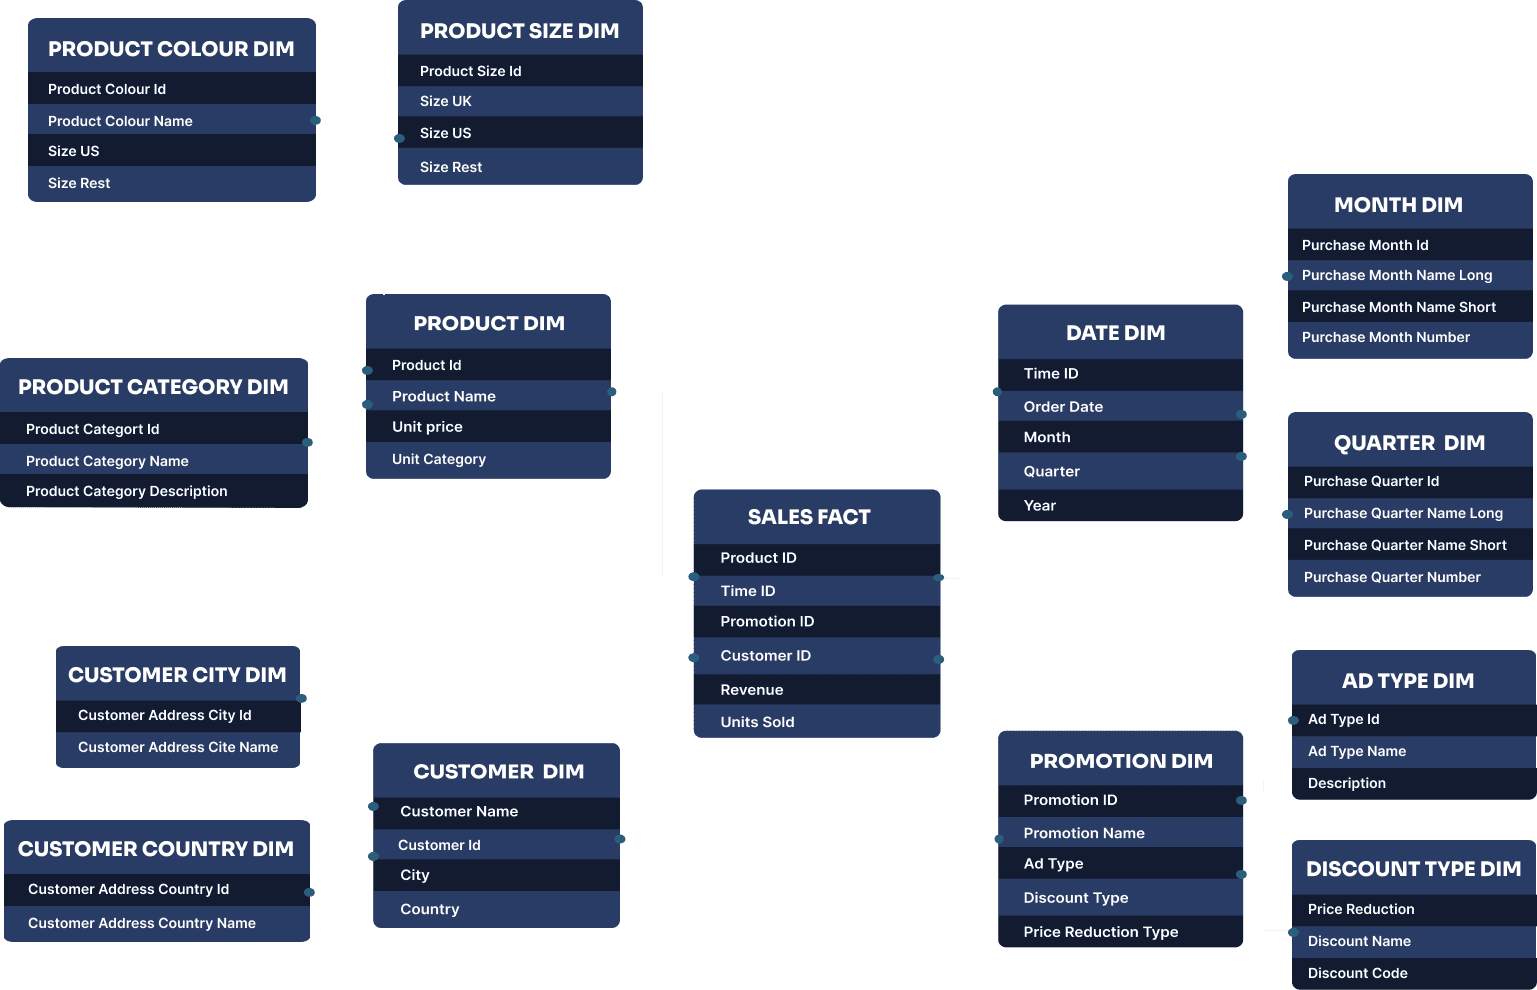
The snowflake schema is called a “snowflake” because the diagram of the schema resembles a snowflake, with the fact table at the center and the dimension tables branching out in multiple directions.
Benefits of dimensional modelling
Dimensional modelling provides a clear framework for understanding complex datasets. Below, we take you through some of the key benefits for adopting dimensional modelling in your data architecture.
Analyse events throughout multiple points in time
Both star and snowflake schemas allow you to relate a fact or event to dimensions at multiple points in time, not just when the event occurred. For example, you can track a product’s sales performance over time, compare it across different time periods, or see which promotions have been associated with the product.
Easily add new records
With dimensional models like star or snowflake schemas, adding new dimensions or facts is straightforward and doesn’t require reprocessing large amounts of data. For instance, if you want to introduce a new dimension like “Promotion” to track marketing campaigns, you can simply create a new dimension table and link it to the fact table without disrupting the existing schema.
Integrate smoothly with reporting tools
Dimensional models integrate well with reporting tools like Power BI or Tableau, as they organise data hierarchically. This structure makes it easier to create intuitive dashboards and reports, enabling users to drill down into specific details or roll up to higher-level summaries with minimal effort.
Reuse dimensions across systems
Shared dimensions, like a “Customer Dimension,” can be reused across multiple systems, including data warehouses, automation platforms, and reporting tools. This reuse promotes consistency in how data is represented and reduces duplication, making it easier to maintain and scale your data architecture.
In summary, while star schemas are generally simpler and faster for querying, snowflake schemas offer greater normalisation and flexibility. Both approaches simplify data management, improve performance, and enhance the usability of analytics systems.
Designing a dimensional model
By thoughtfully organising your data into fact and dimension tables from the start, you can save yourself from having to make time-consuming changes later. Here’s a simple four-step guide to help you create a successful dimensional model.
1. Categorise your reporting needs into business processes
To design your dimensional model, start by outlining which business processes your dimensional model should cover. For example, if your goal is to analyse customer purchasing behaviour, the business process might be “order processing” or “sales transactions.”
If you are creating a dimensional model as part of your data automation strategy, you could start by creating a dimensional model focused on one business process, before moving onto the next. This way, you can start accumulating the other processes as you go while keeping efforts focused.
2. Create an exact description of the dimensional model’s focus
Clearly define the scope and purpose of the dimensional model by outlining the questions you want to ask of your data. For example, if the focus is on sales performance, the model might aim to answer questions like “What are the top-performing products?” or “Which regions generate the most revenue?”
By outlining these questions, you can start to map out the corresponding Key Performance Indicators (KPIs). This step helps to further determine the granularity of the data and gives you a clear starting point from which you can identify the dimensions and facts that need to be included in the model.
3. Identify the dimensions
Start by identifying the dimensions to organise and categorise the data in your dimensional model. Each dimension should have a unique primary key and descriptive attributes that provide additional context. For instance, the “Customer” dimension might include attributes like customer name, age, and loyalty status, while the “Product” dimension might include attributes like product name, category, and price. These dimensions will later be linked to the fact table based on their context.
4. Identify the facts
Once you have identified the dimensions, you can better understand which facts are relevant to the business process. For example, if your dimensions include “Region” and “Product,” facts like “Sales Revenue” and “Units Sold” naturally align with these dimensions.
Throughout the dimensional modelling process, it’s important to consider the granularity of what you are trying to measure. For example, in a sales model, will you track sales at the daily level, per transaction, or per product? By following these steps, you will have a clear conceptual outline of the dimensional model for your use case.
Dimensional modelling helps organise and optimise data to support business intelligence and analytics. By structuring data into fact and dimension tables, you can create a model that is intuitive, scalable, and efficient for querying and reporting. Whether you’re designing a star schema or a snowflake schema, the key is to focus on the business processes, define clear dimensions and facts, and ensure the granularity aligns with your analytical goals. A well-designed dimensional model makes populating and maintaining your database, warehouse or data automation platform easier, and minimises the risk of having to reconstruct systems later on.
What do you mean by dimensional modelling?
+What is the difference between a dimensional model and a relational model?
+A dimensional model is designed for analytical purposes, focusing on ease of querying and reporting by organising data into fact and dimension tables. It is optimised for read-heavy operations and is commonly used in data warehousing.
A relational model, on the other hand, is designed for transactional purposes, focusing on data integrity and normalisation. It organises data into tables with strict relationships and is optimised for write-heavy operations, such as inserting, updating, and deleting records in transactional systems.
About the author

See Bragi in action
Learn more about Bragi’s data automation capabilities in a personalised demo
Speak directly to Bragi’s co-founders, not a sales agent, and explore how Bragi can automate your data processes and transform your data workflows.